Emergency Department Dashboard Fact Sheet
Download document
PDF 412 KB
The dashboard provides patient flow, capacity to be monitored in the metro public hospital emergency departments.

The Emergency Department (ED) dashboard consists of eight sections, which together enable patient flow to be monitored in all public hospital ED and show hospital capacity across metropolitan Adelaide.
More information can be found in the detailed glossary (PDF 430KB).

This table is a summary of the status of all EDs across the state, currently only metropolitan data is collected.
Users can click on their chosen hospital in this table and the whole dashboard will update to show data specific to that hospital.
Colour coding is used to indicate the status of each hospital at any given time. Each colour represents a particular status, which is consistent across all sites.
ED status is calculated from the total number of patients in the ED (both in treatment spaces and in the waiting room), versus the total capacity of the ED.
Each hospital has processes in place to be able to continue to function safely and effectively during periods of high demand.
Any patient requiring urgent care will be seen as soon as possible, and no patient who presents to the ED will be turned away.
Each hospital has processes in place to be able to continue to function safely and effectively during periods of high demand.
All patients who present to the ED requiring emergency or urgent attention are seen as soon as possible. This may mean that people requiring less urgent treatment may wait longer than usual to be seen.
Increased demand can also lead to longer waits to be placed in beds following admission through the ED. However, all patients continue to receive appropriate medical and nursing care while waiting for a bed.

On arrival to ED patients are assessed and then assigned to a stream of care appropriate to their needs. This component of the dashboard shows the breakdown for the selected hospital of the number of patients in each stage of care (e.g. ‘waiting to be seen’ or ‘being treated’) for each stream. For more information on the specific streams please see the glossary (PDF 430KB).
‘Waiting to be seen’ means that a patient has been seen by a triage nurse and is now waiting to be seen by a clinician.
‘Being treated’ means that a patient has been seen by a clinician and is now waiting for a bed in an inpatient unit, to be admitted within the ED, discharged or has left before treatment is complete.
‘Waiting for a bed’ means the patient is waiting for a bed within an inpatient unit and is now waiting to be discharged from the ED.
‘Admitted within ED’ is when a patient has been admitted to an ED bed.
EECU (Extended Emergency Care Unit) 24 hour ward for patients who present at ED and need monitoring for up to 24 hours but can then be sent home.

The KPI’s are used by hospital staff to track operational statistics to assist the management of patient flow within the ED. The three graphs shown relate to patients admitted to hospital from the ED and the time spent in the ED.
Shows the patients that were admitted into the hospital as a percentage of the total number of patients that have departed from the ED for the current date.
Shows the ED patients where the length of stay in the ED is less than 4 hours, as a percentage of the total number of patients that have departed from the ED for the current date.
Shows the ED patients where the length of stay in the ED is less than 4 hours, as a percentage of the total number of patients that have departed from the ED for the current date excluding those admitted to the hospital.
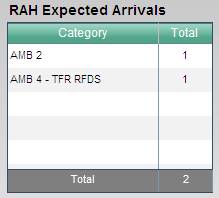
This table displays the total number of patients that are understood to be inbound to the selected hospital either via ambulance (all hospitals) or other means (currently only for WCH Women’s Assessment Service).
The total expected arrivals for each hospital is also shown in the ‘EA’ column of the Hospital Status table.
This shows the number of patients who have departed from the ED within the last sixty minutes and the reason for the departure.
This information is updated every 30 minutes and will synchronise with the total number of departures in the 24 hour activity chart at every whole hour.
This table displays the current number of patients in the ED by triage category. Each triage category is split into the number of patients with a status of ‘waiting to be seen’ and those with a status other than ‘waiting to be seen’.
Nurses and clinicians use a triage system to assess a patient’s clinical urgency. All incoming patients are assigned a triage category based on their individual clinical needs, using a nationally agreed scale.
All of SA’s metropolitan hospitals EDs use the five-tier Australasian Triage Scale (ATS) for categorising ED patients. The scale includes guidelines for wait times for each category.
For more information on the different triage levels please see the glossary (PDF 430KB).

Focussing on patient flow this component is a graphical object showing the last rolling 24 hours activity in the ED taken as a summary at the end of each hour. It shows the number of patients physically in the ED at the end of the hour broken into those who were waiting to be seen and patients who had commenced treatment, as well as the number of arrivals and departures in each hour.
The information is displayed against a backdrop of colour coded capacity figures used in the hospital status table.
Calculated from the numbers of patients in the ED waiting to be seen, compared to total treatment rooms available.

This table shows a breakdown of the wait times being experienced by the patients as they move through the various stages of the ED process. Each stage shows the number of patients that are currently waiting within the defined time periods.
The same information is shown graphically in the chart beside the table where each time period is colour coded.
Waiting for Radiology data is not currently available.
Waiting for IP Consult means a patient may need to be admitted to the hospital and is waiting to be reviewed by the relevant inpatient Doctor to confirm the need for admission.
** Flinders Medical Centre do not currently have inpatient consultation data available.
Hospital EDs are for emergencies. Anyone who does not need immediate, urgent care should visit their GP or phone Healthdirect Australia on 1800 022 222 for assistance.
However, all patients who present to the ED requiring emergency attention are seen as soon as possible. No patient who presents to an ED will be turned away.
24 hour services are available at all metropolitan hospitals which includes: